Walk through any vitamins aisle and you’re served up an alphabet soup of health products from A to Zinc. Since the Covid-19 pandemic, retailers have seen double-digit comp-store growth for the vitamin, mineral, and supplements category (“VMS”), according to data provider Nielsen. Simporter’s AI models predict that wellness trend will continue in 2021, but of course common sense tells us that too.
The unpredictability of health products economic growth
But common sense cannot provide us insights into which attributes in the health category are poised for the most rapid growth. Consumer demand changes too rapidly, fueled by social media and word of mouth. For example, at the start of the pandemic, demand for immunity-boosting supplements spiked. A few months later, however, demand for supplements that promote more restful sleep accelerated, a function of consumers struggling with anxiety around the quarantine, home-schooling their children, and economic uncertainty.
Foreseeing such shifts is critical for VMS manufacturers and retailers. This is where state-of-the-art demand sensing can empower new product development. Here’s Simporter’s 5-point process to uncover the important attributes poised to drive consumer trial.
Start with search & focus on relevant keywords

Search trends from Google and Bing provide a foundational context to consumer demand, using their own language as a guide. Search serves as a leading indicator in your analysis. Of course, consumers do not neatly type a product name into the search box each time. They may search:
- a general area;
- a brand or product name;
- the problem that’s worrying them (their need-state), or;
- a benefit they want.
Search results can be presented in ranges or brackets by month. The key is to rank the attributes that you are considering and watch those search trends over time. Simporter does this automatically.
The volume of keywords is key for automation. In this example, our system collected 21,000 keywords around vitamins and categorized them into 4,500 groupings in the VMS space.
Layer in Health Products Competition
The second important factor is whether competition is already offering up the attributes that are in demand. Digital advertising serves as an important “lagging indicator” to show where competition has coalesced. Companies pay for keywords based on the value of the consumers they reach so this serves as a natural market-clearing mechanism to see where competitors have staked out territory.
If there’s lots of digital advertising for certain keywords around a product area, their price rises relative to the category peer group. This suggests you may be late to the party. For example, keywords around “Apple Cider Vinegar” got very popular and relatively expensive in 2019 as that became a niche hit in the natural foods and supplements markets.
In contrast, keywords with lower digital ad prices often represent untapped opportunities, particularly if their prices only recently began to move. Understanding this data in motion – its trend slope – is quite important.
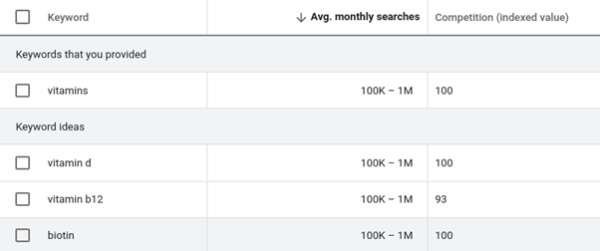
There are a variety of services we use to collect advertising support. For this example we show results provided by a leading digital advertising supplier, indexing from 0-100 the relative cost of keywords for advertising.
All the vitamin keywords shown below are in the same bracket for frequency of consumer monthly searches. The index for competition around digital advertising for vitamin B12 is lower than the others, which bears examination—but for this article, we will stick with a simpler illustration around vitamin D and dive a bit deeper.

Ladder down to attributes with high relevance
Armed with a huge list of keywords, our process groups all these different search queries using Natural Language Processing (“NLP”). This is the same branch of AI that lets you talk to Alexa or Siri. However, instead of getting your favorite song going, the NLP interprets relationships between tens of thousands of keywords based on their meanings. Machine Learning algorithms classify all keywords and phrases that relate to a particular consumer demand area. Then, Simporter models juice the data up with a huge new slug of data from eCommerce:
All those keywords
EVERY consumer review written using one of those keywords
This is where the power of artificial intelligence shines since we’re dealing with large numbers. Thousands of keywords x thousands of product reviews = tens of millions of consumer data points worth paying attention to.
To go from a simplistic “more people are searching vitamin D” to uncover new insights around vitamin D, artificial intelligence is necessary. It rapidly ladders thousands of terms that are relevant to the original keyword, ranking them based on what you need to pay attention to.
You may want to learn about grants for climate change which provides helpful information about applying for grants related to climate change.
Use quadrant analysis to narrow focus and make learnings actionable
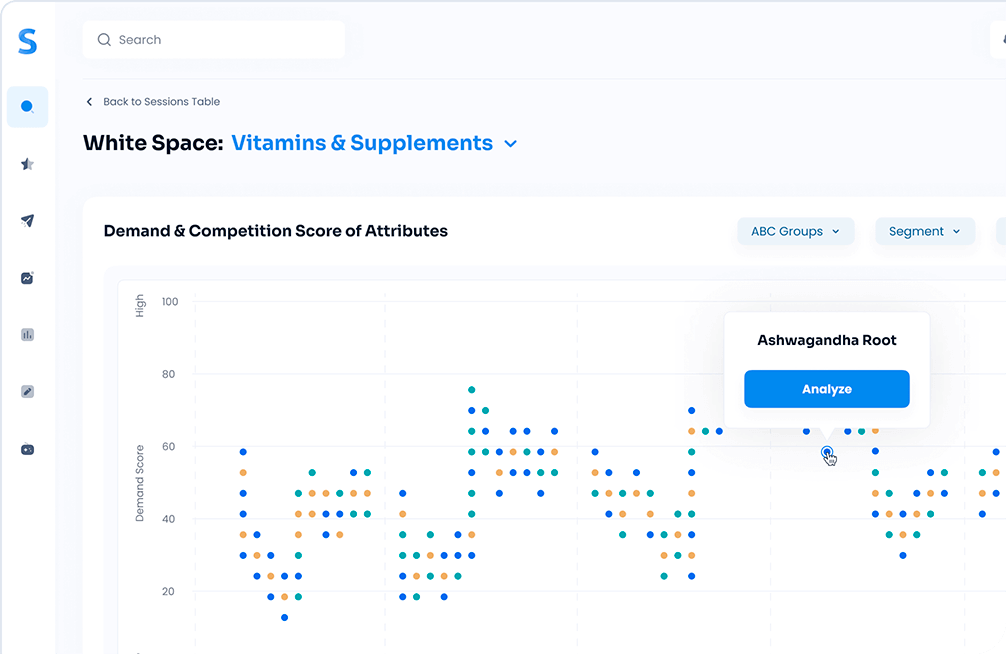
Next, we plot keywords in terms of high consumer demand and low competition – that magic quadrant in the upper right. Simporter’s software does this automatically, but other widely available tools can be used for similar mapping. We preserve confidentiality around attributes in the magic quadrant — #191 and #43 here – because we have clients in the vitamins area. But we can talk about a better-known example, the subset of Vitamin D called “Vitamin D3.” It’s in the middle of the pack for competition and higher for demand.

Cross-analyze products that had consumer reviews written about their attributes
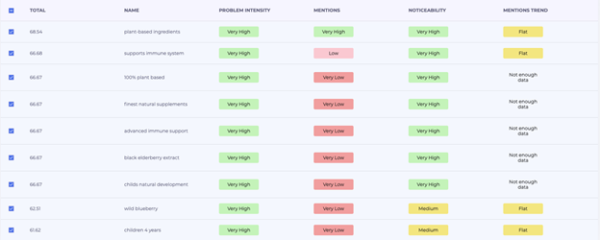
Diving into Vitamin D3 specifically, here’s the first page of results about it. Our AI-driven software found 399 different products that have consumer reviews mentioning Vitamin D3. There was a total of nearly one hundred thousand consumer reviews analyzed just for this term.


Everything under the “Name” column is an attribute consumers wrote about Vitamin D3 – a need-state, a characteristic, benefit, ingredient, flavor, and so forth. The other columns are diagnostics that show the intensity that consumers feel about each attribute, the ratio of how often consumers mention the attribute compared to manufacturers writing about it in product descriptions and claims; and other metrics (sign up for a demo if you would like more info on these diagnostics).
In the case of Vitamin D3, we can immediately see that plant-based and natural ingredients are important to consumers. But notice a couple other attributes that consumers talk about – “child’s natural development,” “children 4 years,” and “supports dental health” – are each ranked among the top 15 attributes. There’s a germ of an insight there around vitamins and oral care, and with a bit more digging you can uncover powerful findings that open new product opportunities for incorporating Vitamin D3– and leverage a built-in audience of consumers predisposed to trial.
Industry 4.0 refers to the fourth industrial revolution, which is characterized by the integration of advanced technologies such as artificial intelligence, the Internet of Things (IoT), cloud computing, big data analytics, and other digital technologies into the manufacturing process.
Remember, Vitamin D3 was just one avenue the software went down but, concurrently, it traversed hundreds more. This 5-step methodology rapidly provides relevant and temporal consumer data with fingertip access — all thanks to the power of AI.


